.jpg)
Introduction
The global streaming war has intensified, with platforms like Netflix, Prime Video, and Disney+ constantly competing for viewer attention. Every day, “Top 10” lists change across countries, reflecting regional preferences, content virality, and trending genres. For content creators, OTT platforms, and entertainment analysts, tracking global OTT rankings is essential—and web scraping is the most efficient way to do it.
OTT Scrape offers real-time show rankings scraping services to monitor daily content performance across regions like the USA, UK, India, and Japan.
Why Track Top 10 Streaming Rankings?

Top 10 lists aren’t just entertainment—they're insight-rich datasets that help:
- OTT platforms benchmark performance
- Marketers time campaigns around trending content
- Content studios understand genre demand by country
- Investors spot global hits early
For example, the sudden spike in “Squid Game” in Japan or “The Railway Men” in India could signal genre surges or viral content waves.
What Web Scraping Offers in the Streaming Ecosystem
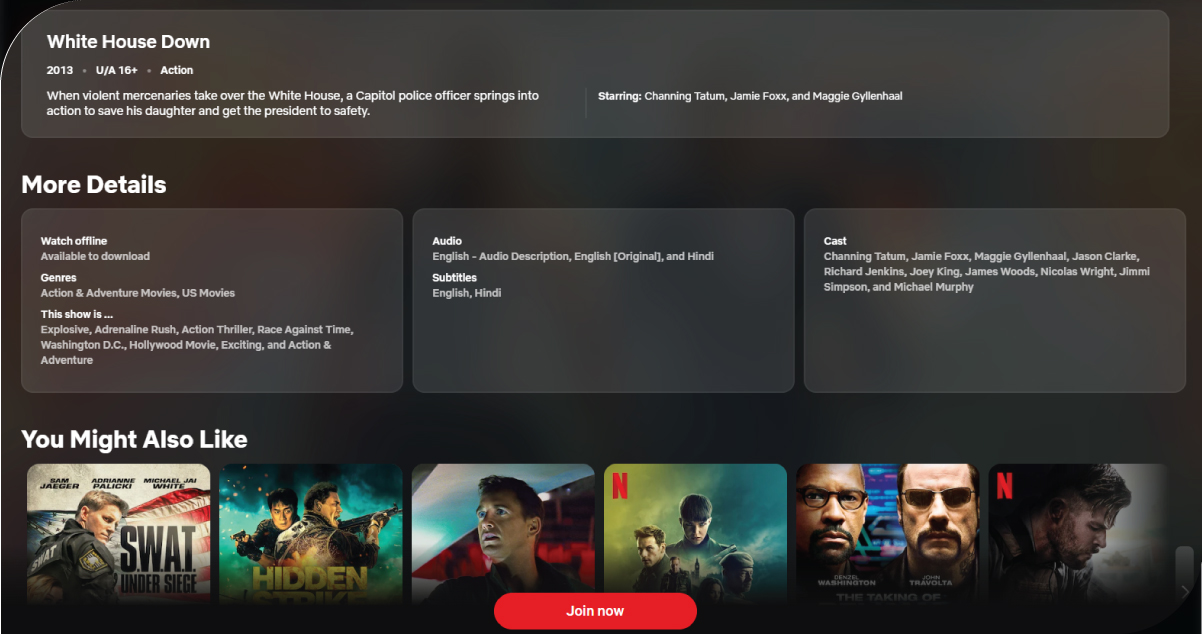
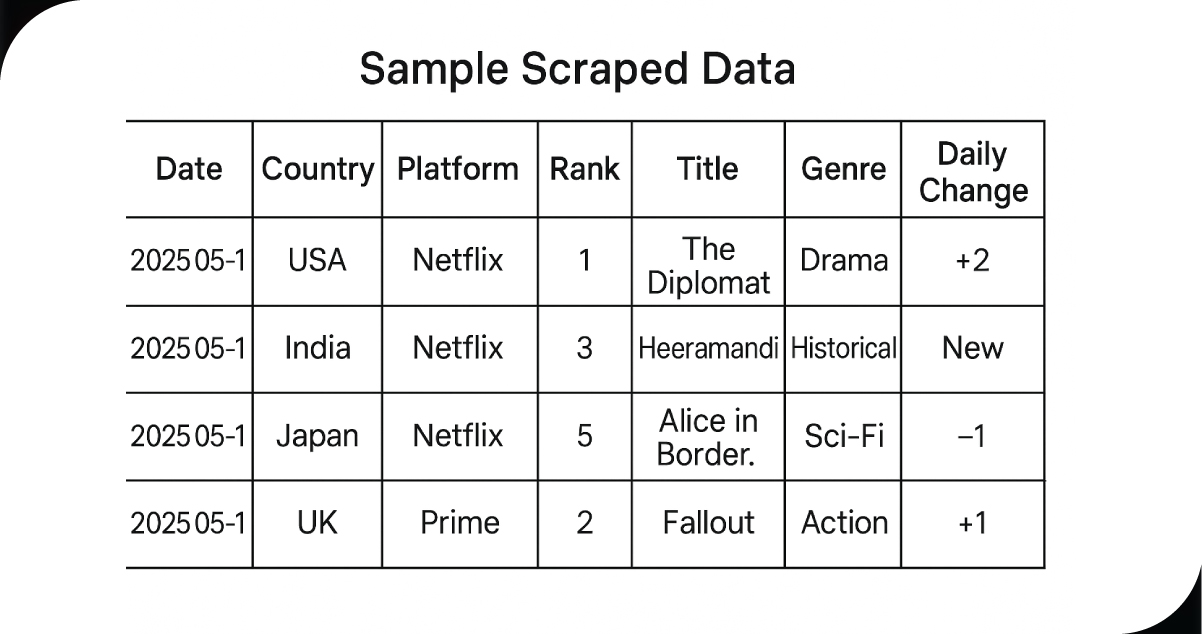
Manual tracking of these rankings is time-consuming, especially with daily fluctuations and country-specific content. Web scraping automates this process, offering structured data on:
- Title
- Rank (1–10)
- Platform (e.g., Netflix, Prime)
- Genre
- Description
- Country
- Daily change indicator
- Thumbnail image URL
Sample Scraped Data
How OTT Scrape Collects Global Show Rankings
Step-by-Step Process
1. Target Platform Detection
Identify platform URLs showing Top 10 lists (e.g., Netflix’s top10.netflix.com, Disney+ explore tabs).
2. Crawler Design
Build location-specific scrapers using proxy-based architecture to mimic users from USA, UK, India, and Japan.
3. Data Normalization
Normalize content fields such as titles, genres, descriptions, and country tags.
4. Change Tracking Engine
Tag daily movements (e.g., “New”, “+2”, “-1”) to help track momentum.
5. Delivery Format
- CSV or JSON downloads
- API for real-time integration
- Dashboard for multi-country view
Use Cases for Streaming Show Rankings Scraping
1. OTT Platform Competitor Monitoring
Platforms like Amazon Prime or Apple TV+ can monitor Netflix’s daily hits and adapt content strategy accordingly.
2. Content Studios & Distributors
Studios can analyze genre dominance in a country before planning localized content releases.
3. Influencer & Creator Collaboration
Marketing agencies identify trending shows to pitch branded content ideas or meme campaigns.
4. Investor Intelligence
Track rising titles for early investment into breakout creators or licensing deals.
Country-Wise Streaming Trends via Web Scraping
USA
- Genres like true crime, political thrillers, and sci-fi dominate.
- High volatility in rankings—new shows trend and vanish quickly.
UK
- Preference for docuseries, historical drama, and British crime shows.
- Rankings show strong presence of local productions (e.g., Top Boy).
India
- Rapid rise of Hindi original web series like Heeramandi, The Family Man, and Sacred Games.
- Strong OTT diversity across languages: Hindi, Tamil, Telugu, Malayalam.
Japan
- Dominance of anime and sci-fi thrillers.
- Netflix’s investment in local production visible in the Top 10 frequently.
Sample Dashboard Visualizations
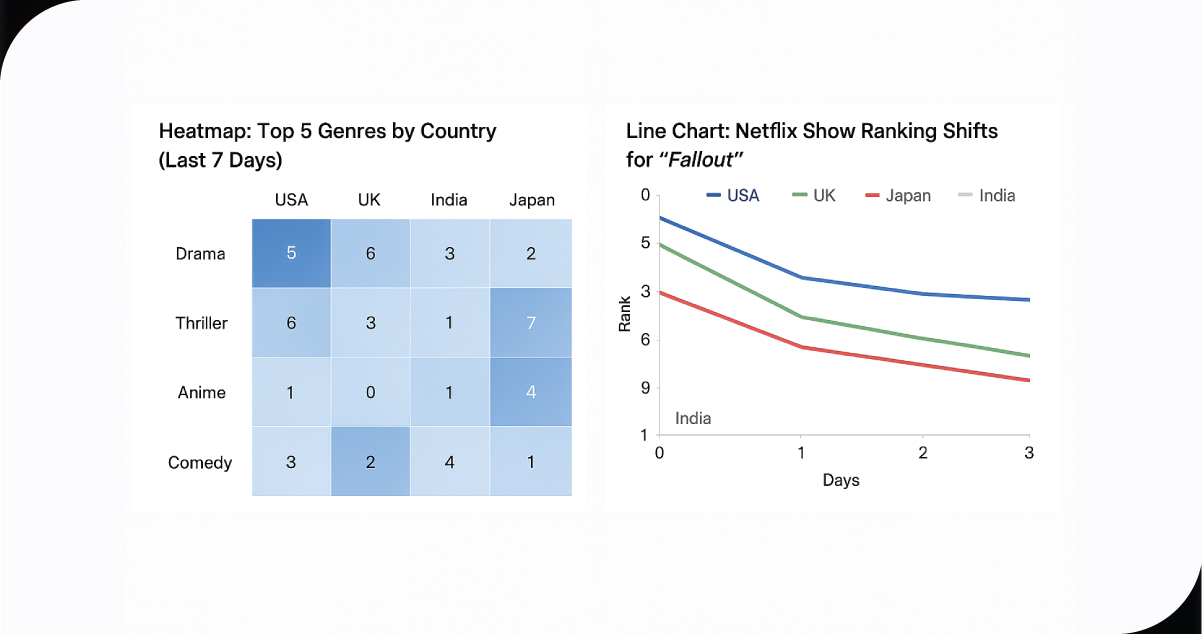
1. Heatmap: Top 5 Genres by Country (Last 7 Days)
| Genre | USA | UK | India | Japan |
|---|---|---|---|---|
| Drama | 5 | 4 | 6 | 2 |
| Thriller | 6 | 3 | 3 | 4 |
| Anime | 1 | 0 | 1 | 7 |
| Comedy | 3 | 2 | 4 | 1 |
2. Line Chart: Netflix Show Ranking Shifts for "Fallout"
- USA: Rank 4 → 1 (in 3 day)
- UK: Rank 7 →
- India: Unlist
- Japan: Rank 9 →
Technology Stack at OTT Scrape
- Web Scraping Tools: Python (BeautifulSoup, Scrapy), Puppeteer
- Proxies & Rotation: Smartproxy, Oxylabs for geo-location masking
- Data Processing: Pandas, Regex, NLP sentiment tagging
- Storage & API: AWS S3, Firebase, MongoDB
- Dashboard Integration: Power BI, Looker Studio, Grafana
Case Study: Tracking Netflix Top 10 in India for a Media Agency
Client: Mumbai-based OTT ad agency
Challenge: Needed daily updates on Top 10 shows across Netflix India to plan trailer placements and brand inserts.
Approach:
- Deployed a geo-targeted crawler for Netflix India’s trending page
- Scraped rank, description, thumbnails, and genre daily
- Delivered a Power BI dashboard with sentiment alerts on user tweets/comments
Outcome:
- Helped client identify best days for promo rollouts
- Boosted campaign engagement by 23% for 3 major web series
Legal & Compliance Considerations
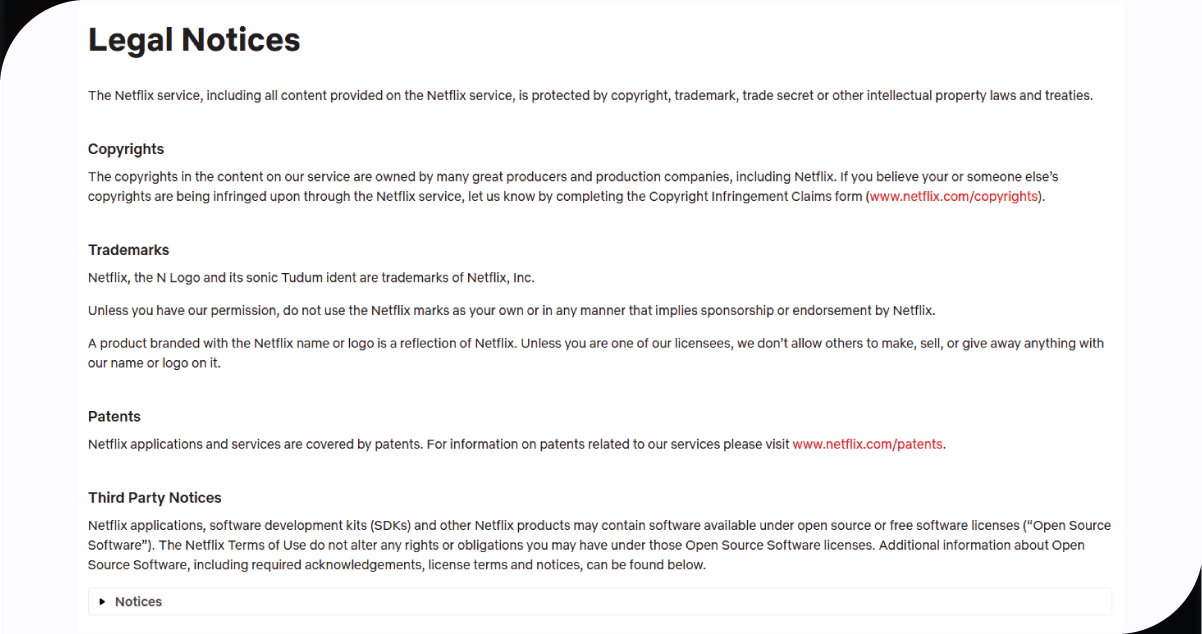
OTT Scrape ensures:
- Adherence to platform policies
- Respect for robots.txt exclusions
- Rate-limiting and ethical scraping practices
- Data usage for insights only, not redistribution of copyrighted content
Final Thoughts
In today’s global streaming race, understanding what’s trending—and where—can be the key to better content planning, smarter investments, and sharper marketing. Web scraping helps cut through the noise and deliver real-time competitive intelligence.
OTT Scrape empowers creators, analysts, studios, and marketers to tap into live show rankings across Netflix, Prime, Disney+, and more—in the USA, UK, India, Japan, and beyond.
