
Introduction
Video platforms generate extensive signals that reveal how audiences respond to different formats, topics, creators, and publishing patterns. Bilibili provides particularly useful performance indicators through views, likes, comments, shares, and other visible engagement signals. Examining these indicators collectively helps content teams understand which characteristics contribute to stronger visibility, interaction, and sustained audience interest.
Businesses and media teams can Scrape Bilibili Data to organize these signals into structured datasets for comparative analysis. Instead of reviewing individual videos manually, analysts can evaluate recurring patterns across creators, genres, publishing schedules, and engagement levels. This creates a broader perspective on audience behavior while reducing the effort required to monitor large volumes of video content.
With our Bilibili Video Data Scraping for Content Performance provides a structured approach to evaluating content results through measurable indicators rather than assumptions. Comparing engagement ratios, audience reactions, video popularity, and topic performance can reveal repeatable success patterns. These findings can support content planning, creator evaluation, competitive benchmarking, performance reporting, and more informed decisions about future video strategies.
Audience Signals Expose Patterns Behind Successful Video Themes
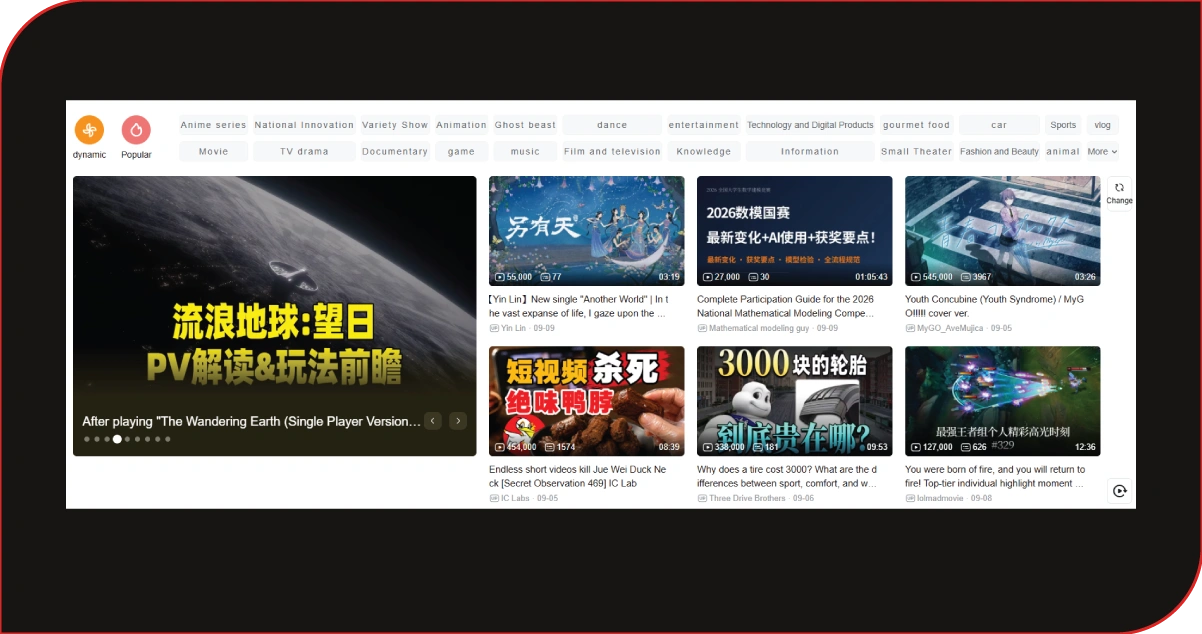
Audience response can vary considerably depending on the subject, presentation style, creator profile, and publishing approach. A structured analysis of these factors helps teams identify themes that repeatedly attract attention instead of relying on isolated viral results. Bilibili Video Analytics Data Extraction Services can organize performance indicators across multiple categories, allowing analysts to compare audience behavior with greater consistency.
Such comparisons can show whether certain themes maintain engagement over time or simply experience short periods of popularity. Genre-level evaluation becomes particularly useful when content teams need to understand broader audience preferences. Scrape Popular Genres Data can help identify categories associated with stronger views, reactions, and sharing activity.
Several indicators can be reviewed together to create a more balanced understanding of performance:
- Average views across comparable content categories
- Engagement rates relative to total visibility
- Comment activity indicating audience discussion
- Sharing activity showing broader content circulation
- Performance differences between new and established creators
When these signals are compared across multiple videos, analysts can identify common characteristics within successful categories. This may include recurring subjects, video duration, publishing frequency, storytelling styles, or creator positioning that appear repeatedly among higher-performing content.
| Performance Indicator | Illustrative Average | Strategic Signal |
|---|---|---|
| Views | 420K | Overall visibility |
| Likes | 31K | Positive response |
| Comments | 4.8K | Audience discussion |
| Shares | 7.2K | Content circulation |
Looking at these measurements collectively gives content teams greater context when evaluating successful themes. A video with moderate views but unusually high comments may indicate strong community interest, while substantial sharing activity can suggest broader relevance beyond the platform's immediate audience. This approach makes content evaluation more practical and supports stronger decisions about future themes, formats, and publishing priorities.
Popular Content Patterns Clarify What Sustains Viewer Attention
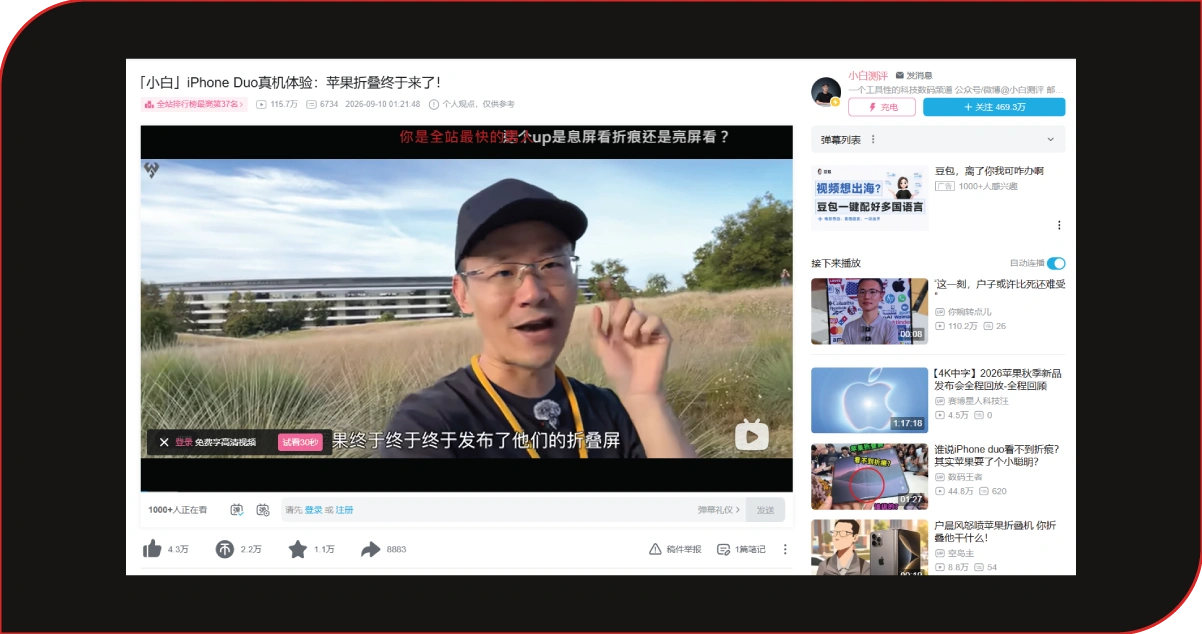
Video popularity is influenced by several connected factors, including topic relevance, presentation format, creator consistency, and audience expectations. Examining these elements together allows analysts to move beyond simple view counts and understand why certain content maintains stronger attention. Extract Bilibili Video Engagement and Audience Data can provide structured indicators for comparing interaction levels across different videos, creators, and content categories.
Recurring programs and established content formats can also provide useful performance signals. Scrape Popular Shows Data allows teams to compare audience activity across recurring series, programs, and popular formats. These comparisons can reveal whether episodic structures, educational formats, commentary-based videos, or short-form presentations generate more consistent interaction.
Useful measurements can include:
- Performance differences between episodic and standalone videos
- Engagement levels across different presentation formats
- Viewer response to recurring content themes
- Changes in popularity across publishing periods
- Interaction patterns among established and emerging creators
Comparing these patterns can help content planners identify characteristics associated with stronger viewer retention and interaction. For example, recurring formats may encourage audiences to return regularly, while tutorial content may generate stronger engagement because viewers have a specific informational purpose. These observations become more valuable when evaluated across larger datasets instead of individual examples.
| Content Pattern | Illustrative Engagement | Possible Interpretation |
|---|---|---|
| Episodic Videos | 8.4% | Encourages repeat viewing |
| Tutorials | 7.1% | Provides informational value |
| Commentary | 6.6% | Supports audience discussion |
| Short Clips | 5.9% | Encourages quick interaction |
Teams can examine which content structures perform well during specific periods, which topics produce recurring engagement, and which formats receive stronger audience reactions. This creates a clearer foundation for editorial decisions and helps transform historical performance observations into practical guidelines for developing future video content.
Engagement Intelligence Shapes More Effective Content Strategy Decisions
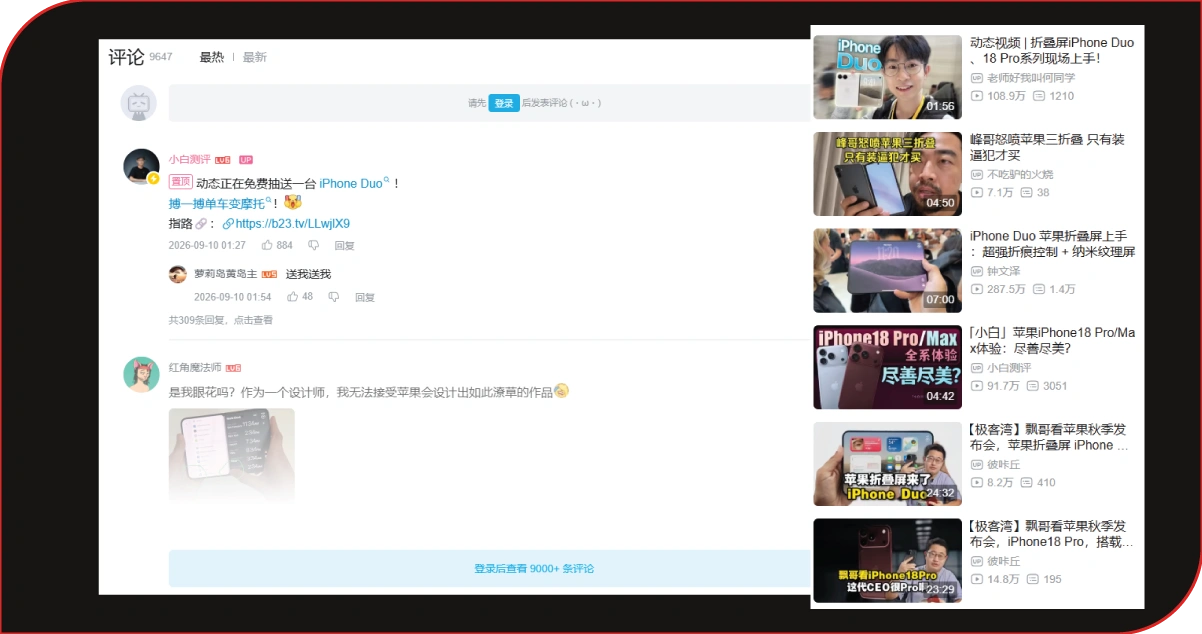
Content performance becomes more meaningful when audience reactions are analyzed alongside video attributes, creator information, and broader engagement trends. Bilibili Content Intelligence Data Extraction can organize these elements into structured datasets that allow teams to compare content performance across multiple dimensions. Rather than evaluating videos through isolated metrics, analysts can examine relationships between visibility, interaction, topic selection, and audience response to identify stronger strategic signals.
Audience behavior provides another important layer of analysis. Bilibili Audience Engagement Data Extraction can help teams evaluate how viewers respond through likes, comments, shares, and other measurable interactions. These signals can highlight content that encourages conversation, creates repeat engagement, or generates wider circulation. When reviewed consistently, they can help distinguish content that simply receives attention from content that develops deeper audience participation.
A practical analysis framework can include:
- Comparing engagement rates across content categories
- Tracking performance changes over defined periods
- Evaluating creator-level performance differences
- Identifying formats associated with stronger interaction
- Measuring audience response against content visibility
Over time, structured performance analysis can also support more precise content experimentation. Teams can compare different formats, topics, publishing schedules, and presentation approaches against previous results. This creates a reliable foundation for refining editorial strategies and improving future content decisions.
| Metric | Illustrative Change | Planning Value |
|---|---|---|
| Average Views | +24% | Highlights stronger topics |
| Comments | +18% | Indicates discussion |
| Shares | +29% | Shows wider circulation |
| Likes | +21% | Measures audience response |
The Significance of Bilibili Data Scraping in Content Strategy Development becomes clearer when these measurements are connected to practical planning activities. Historical datasets can help teams identify recurring performance characteristics, benchmark creators, evaluate content categories, and assess whether strategic changes produce measurable improvements.
How OTT Scrape Can Help You?
Our Bilibili Video Data Scraping for Content Performance can support structured evaluation of videos, creators, categories, and audience reactions. We can help convert scattered platform signals into organized datasets that are easier to analyze, compare, and apply across content workflows.
Key capabilities include:
- Collecting video-level performance information at scale
- Organizing engagement indicators for comparative analysis
- Monitoring content trends across selected categories
- Comparing creators and video formats using consistent metrics
- Tracking changes in popularity across defined periods
- Preparing structured datasets for reporting and strategic analysis
With Extract Bilibili Video Views Likes Comments and Shares, teams can bring key engagement indicators together within a unified analytical framework. This makes it easier to evaluate content performance across multiple dimensions rather than depending on a single popularity metric.
The resulting datasets can support editorial teams, media analysts, entertainment businesses, and content strategists in identifying meaningful patterns. Historical comparisons can also help teams understand how audience behavior changes over time, which formats generate stronger responses, and where content strategies may require adjustment.
Conclusion
Content performance becomes easier to understand when audience behavior is measured consistently across videos, categories, creators, and engagement indicators. Bilibili Video Data Scraping for Content Performance provides a structured approach for identifying recurring patterns behind visibility, interaction, and audience response.
When these insights are organized into actionable datasets, Bilibili Audience Engagement Data Extraction can support better editorial decisions, content comparisons, and future planning. Consistent analysis can reveal which themes, formats, and publishing approaches produce stronger responses across different audience segments. Contact OTT Scrape today to build structured Bilibili data insights for smarter content performance analysis.